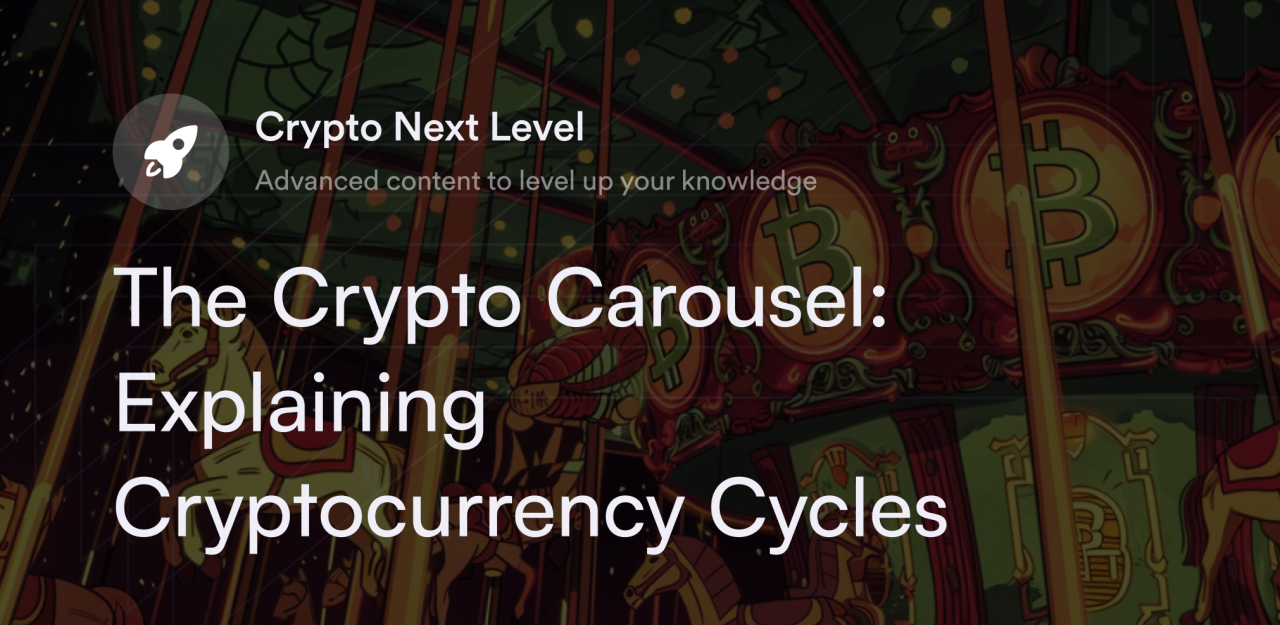
Despite its unpredictability, some traders claim the crypto market actually has a natural ebb and flow, much like the Moon's phases or oceanic tides.
Crypto cycle theory suggests that random spurts of euphoria and panic mask an underlying rhythm in market dynamics and psychology. Many crypto traders believe in the cyclicality of price movements, entering positions only when they feel the season is ripe for profits.
But is there any science to back up crypto cycle theory, or are these seemingly predictable patterns self-fulfilling prophecies? Let’s explore crypto cycles, why some traders believe in them, and whether they’re a reliable tool when trading virtual currencies.
Understanding crypto market cycles
Crypto market cycles refer to a set of observable long-term price patterns and trading behaviors. Traders use historical data on crypto prices plus basic principles of trading psychology to identify cycle correlations, map out similar movements, and forecast the most likely scenarios for the current market.
History doesn't predestine the future price action for cryptocurrencies, but proponents of crypto cycle theory argue there's a noticeable four-stage rhythm (aka seasonality) to the market's pumps and dumps.
Regardless of macro or microeconomic news, traders who support crypto cycle theory argue virtual currencies routinely move through four market phases, each with distinct and identifiable features.
The purported four phases of a crypto cycle chart
In the heat of the moment, it's tough to know where cryptocurrencies are in a "textbook" cycle, but technical analysts observe four major phases all crypto cycles go through. Understanding the characteristics of these phases helps traders make an educated guess about the current market condition and position their portfolios accordingly.
1. The quiet consolidation phase
Also called accumulation, consolidation is considered "the most boring phase" in the crypto cycle, as it would have low trading activity (aka volume), tight price ranges, and minimal media interest in cryptocurrencies as an asset class.
This phase follows price declines (aka bear markets) in the crypto market and represents the "lowest of the low" in terms of price action. A common slang term for this phase is crypto winter since everything in this market is stagnant, cold, and dark.
There's not much hopeful sentiment during consolidation, but traders with a long time horizon often pick up their favorite digital assets to hold (aka HODL) and take advantage of discounts relative to the prior uptrending market (aka bull market).
2. The markup phase "to the moon"
Markup phases purportedly happen when the chilly pessimism of crypto winter starts to thaw and optimism returns to digital assets. More traders might enter the crypto market during this phase, reflected by higher-than-average trading volumes and uptrending price patterns for digital assets.
Positive news events or network upgrades often precede purported markup phases, but it's sometimes hard to pinpoint the exact catalyst for these bull runs.
Also, the fear of missing out (FOMO) is at its peak during market markups, and it's more common to see irrational, emotion-based trading activity as prices reach unprecedented levels.
3. Distribution divergence
Think of the distribution phase as the final standoff between buyers and sellers in the crypto market. After prices trend higher and more traders enter the market during the purported markup phase, people who built positions early during accumulation start to consider locking in profits to take risk off the table.
Prices during distribution typically continue on an uptrend, but price movements are less parabolic than during the market markup, with doubts about how much gas is left in the bull run's rocket ship.
In fact, overoptimistic traders believe there are still higher highs around the corner, but the increased selling pressure from traders with profitable positions makes it difficult for the crypto market to soar as quickly as before.
4. The markdown meltdown
When the bull market breaks down, and sellers overwhelm buyers, the market enters its final markdown phase. During this time, prices for digital assets fall, and the sentiment from traders turns from trepidatious to downright panic. Fear, uncertainty, and doubt (FUD) reign supreme during these stressful periods, and it's more common to see negative headlines, scandals, or news stories as prices continue falling off a cliff.
After the height of the fear subsides and most sellers exit their positions, trading volumes cool, and prices stabilize at lower levels, beginning a new consolidation phase.
How long do crypto cycles last?
There isn't a clear-cut, fixed schedule for planning a future market cycle chart, but some crypto traders subscribe to the four-year cycle theory. In this model, the crypto market goes through the accumulation, markup, distribution, and markdown phases within four years, and there's some historical precedence for this pattern.
For example, the crypto market entered a bull phase in 2017, with Bitcoin (BTC) hitting a new all-time high of almost $20,000 per coin, but the market fell in the following year and didn't approach new highs till the next bull run in 2020–2021.
The four-year crypto cycle coincides with a major prescheduled event in Bitcoin cycles known as halving. This event takes place roughly every four years, where BTC's inflation rate drops by half and computers on the network (aka Bitcoin miners) receive 50% fewer BTC rewards every time they successfully confirm a transaction.
Bitcoin is the oldest and largest cryptocurrency by market cap and holds an influential position in the blockchain space, and any significant changes to Bitcoin's operations tend to affect the overall mood of the crypto market.
Following prior Bitcoin halvings in 2012, 2016, and 2020, the crypto market entered a significant price pump, followed by a crash and consolidation phase. Although previous Bitcoin halvings have a noticeable impact on crypto cycles, there's debate over how strong this correlation is and whether it's likely to play out the same way every four years.
How to identify a crypto market cycle
Nobody knows a crypto market cycle’s phases without the benefit of hindsight, but traders use tools to guess the most likely scenarios. Reviewing these tools is crucial to analyzing current market dynamics and predicting the best opportunities considering historical patterns.
Bitcoin halving cycle chart
Whether Bitcoin halvings trigger bull runs or everyone simply expects them to happen, there's no denying this event majorly impacts the crypto market psychology. In prior crypto cycles, it was common for digital assets to enter a markup phase for about one year after the BTC halving and then fall into a multiyear consolidation phase.
There are no guarantees Bitcoin halvings precede new all-time highs for digital assets, but ignoring this supply adjustment due to Bitcoin's influence and the media hype surrounding halvings is impossible.
Bitcoin dominance chart
Speaking of Bitcoin's influence, a metric called the Bitcoin dominance chart is another helpful tool to glimpse how market participants position their portfolios. This chart measures Bitcoin's market cap relative to the global crypto market cap to show traders the percentage of money in the crypto ecosystem in BTC.
Bitcoin often has volatile price action, but it's often considered a more conservative digital asset due to its longevity, meaning a higher BTC dominance percentage suggests a cautious risk-off atmosphere such as a markdown or consolidation phase. In contrast, when BTC's dominance falls relative to more speculative altcoins, there's a chance the crypto market is in a more risk-on environment, such as a markup or distribution.
Average trading volume
Volume bars are on the bottom of a cryptocurrency's price chart, representing how much money traders exchange daily for digital assets. When volume levels rise on crypto exchanges, chances are the market is entering a more volatile phase, such as the markup or markdown, whereas diminished volume and tight price ranges often correlate with consolidation and distribution.
Crypto Fear and Greed Index
Created by Alternative.me, the Crypto Fear and Greed Index factors in multiple metrics such as price volatility, social media sentiment, and Bitcoin dominance to gauge how traders feel about digital assets. Every day, this index assigns a score from 0 to 100 on the crypto market’s current state, with 0 representing extreme panic and 100 excessive greed.
While this isn't the most scientific tool, it helps traders understand whether market participants feel comfortable or cautious about the crypto market and guess the best time to enter or exit positions.
Eligible traders can trade crypto perps during any season on dYdX
No matter the time in a crypto market cycle, dYdX offers a premier DeFi trading experience for eligible traders who want access to perpetual swaps. Since perpetuals don't have expiry dates, they're flexible financial vehicles ideal for eligible traders interested in short-term price speculation or hedging HODL portfolios. Learn more about the intricacies of using dYdX's suite of features on our official blog. Also, check out dYdX Academy for more pro tips on crypto trading and Web3 security, and eligible traders start trading on dYdX today.
Disclosures
The content of this article (the “Article”) is provided for general informational purposes only. Reference to any specific strategy, technique, product, service, or entity does not constitute an endorsement or recommendation by dYdX Trading Inc., or any affiliate, agent, or representative thereof (“dYdX”). Use of strategies, techniques, products or services referenced in this Article may involve material risks, including the risk of financial losses arising from the volatility, operational loss, or nonconsensual liquidation of digital assets. The content of this Article does not constitute, and should not be considered, construed, or relied upon as, financial advice, legal advice, tax advice, investment advice, or advice of any other nature; and the content of this Article is not an offer, solicitation or call to action to make any investment, or purchase any crypto asset, of any kind. dYdX makes no representation, assurance or guarantee as to the accuracy, completeness, timeliness, suitability, or validity of any information in this Article or any third-party website that may be linked to it. You are solely responsible for conducting independent research, performing due diligence, and/or seeking advice from a professional advisor prior to taking any financial, tax, legal, or investment action.
You may only use the dYdX Services in compliance with the dYdX Terms of Use available here, including the geographic restrictions therein.
Any applicable sponsorship in connection with this Article will be disclosed, and any reference to a sponsor in this Article is for disclosure purposes, or informational in nature, and in any event is not a call to action to make an investment, acquire a service or product, or purchase crypto assets. This Article does not offer the purchase or sale of any financial instruments or related services.
By accessing this Article and taking any action in connection with the information contained in this Article, you agree that dYdX is not responsible, directly or indirectly, for any errors, omissions, or delays related to this Article, or any damage, injury, or loss incurred in connection with use of or reliance on the content of this Article, including any specific strategy, technique, product, service, or entity that may be referenced in the Article.